Decay of linkage disequilibrium
In recombining populations, genetic linkage decays with time. This
script initializes a population with high linkage disequilibrium (LD)
and tracks how LD. The example can be found in decay_of_LD.py.
First, we load the FFPopSim module, along with the number crunching and plotting tools:
import numpy as np
import matplotlib.pyplot as plt
import FFPopSim as h
Next, we set up the population:
# specify parameters
N = 500000                          # Population size
L = 4                               # number of loci
mu = 0.0                            # no new mutations
r = 0.01                            # recombination rate

### set up
pop = h.haploid_lowd(L)             # produce an instance of haploid_lowd with L loci
pop.carrying_capacity = N           # set the steady-state population size
pop.set_recombination_rates(r)      # assign the recombination rates
pop.set_mutation_rates(mu)          # assign the mutation rate

# initialize the population with N/2 individuals with genotypes 0, that is ----
# and N/2 with the opposite genotype 2**L -1, that is ++++
pop.set_genotypes([0, 2**L-1],[N/2, N/2])
Third, we let the population evolve and we track linkage disequilibrium via the get_LD function:
max_gen = 50
#get LD for locus pairs (0,1), (0,2) and (0,3)
LD_trajectories = [[pop.generation,pop.get_LD(0,1), pop.get_LD(0,2), pop.get_LD(0,3)]]
for ii in range(max_gen):
    pop.evolve(5)               #evolve 5 generations
    #get a new set of LD values
    LD_trajectories.append([pop.generation, pop.get_LD(0,1), pop.get_LD(0,2), pop.get_LD(0,3)])
LD_trajectories=np.array(LD_trajectories)      #cast to an array for plotting
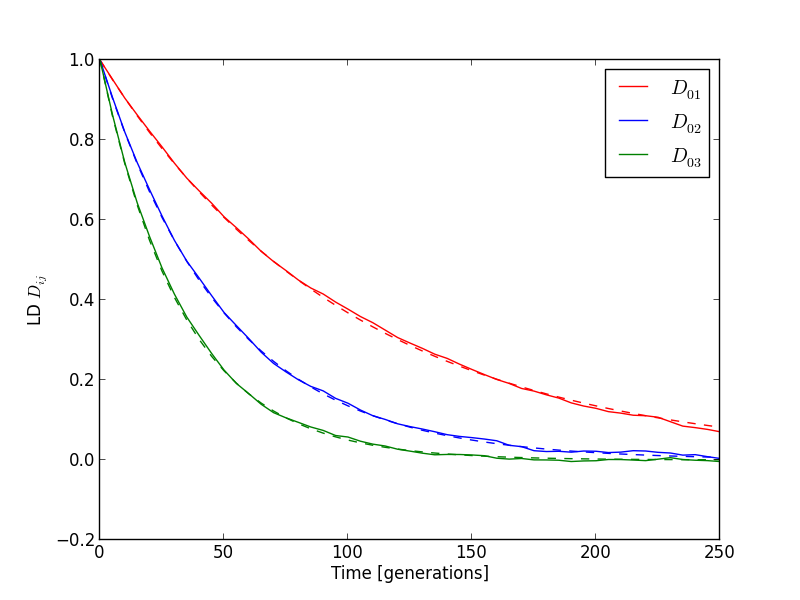
Fourth, we plot the resulting linkage disequilibrium curves:
cols = ['r', 'b', 'g', 'm', 'c']
for ii in range(LD_trajectories.shape[1]-1):
    #plot the LD from simulations and compare it to the exponential decay expected from theory
    plt.plot(LD_trajectories[:,0], LD_trajectories[:,ii+1], color=cols[ii], label=r'$D_{1'+str(ii+1)+'}$')
    plt.plot(LD_trajectories[:,0], 0.25*np.exp(-LD_trajectories[:,0]* r * (ii+1)), ls='--', color=cols[ii])

plt.legend()
plt.xlabel('Time [generations]')
plt.ylabel('LD $D_{ij}$')

plt.ion()
plt.show()
As expected, LD decays faster if loci are further apart. The typical plot we obtain is the following and shows complete concordance of theory and simulations: